Optimal Buy and Sell Estimation Using BetterInvesting.com
Authored by: Frank Braker
I recently started using BetterInvesting.com. In this guide you will learn about tools found there.
What The Tools Provide
These tools allow answering the following questions:
Is a company healthy?
In the vast ocean of publicly tradable companies, we find a spectrum of varying degrees of company health, from the highly profitable to those that will soon declare bankruptcy. Within seconds any given company can be visually understood in terms of Sales relative to competitors, Sales growth, Earnings per Share, Stock price, Pre-tax profit on Sales, ROE (return on equity), Total Debt, and Debt to Capital. These indicators are presented visually to allow seeing long-term trends.Should I buy this company now? Sell it? How can I tell?
Forecasting high and low estimated prices based on historical data and fundamentals allows a methodical process for determining where to buy and where to sell - no more guessing or hoping for a price that may never happen.
2 stock research tools are provided at BetterInvesting.com:
CoreSSG: this is “the tutorial” mode of the toolset. Use this for guidance and a detailed explanation of each step in evaluating a company. A limited number of stock symbols can be fully evaluated for free in the trial version of BetterInvesting.com
SSGPlus: this is “the advanced” mode of the toolset which offers a condensed overview in a few screens.
Price
To complete this guide, you won’t have to pay anything. When you are finished, consider buying the tools to open an account at Betterinvesting.com. The price is roughly $10/month for the full suite of tools, and a marginally cheaper price for the “basic” tools. I recommend buying the full suite for a full year as it is relatively affordable, especially for the service the tools provide.
Workflow
If you go to BetterInvesting.com - there’s a lot of interesting fluff to read. You can join groups and spend time reading the site wondering what all this is.
Instead of wondering what this is, open this link instead:
https://ssg.betterinvesting.org/trial/ssgplus.aspx?ticker=fds
Notice that I have highlighted “ssgplus” in the link. We’ll see why, below, but first have a look at the screen the link gives - it will look something like this:

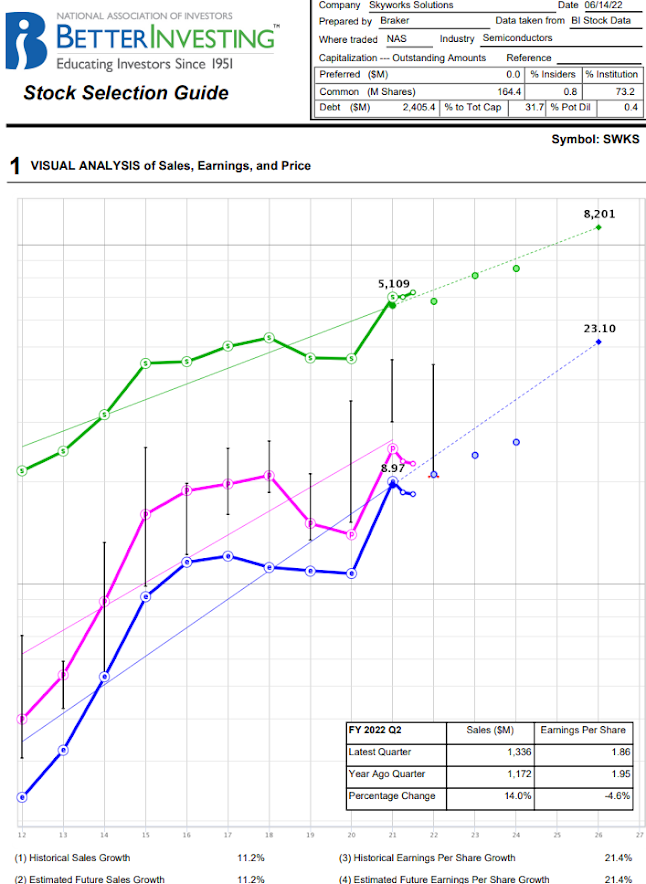
This is the advanced tool. For a summary screen of determining a company’s health, make sure the green “sales”, pink “pre-tax profit” and the blue “EPS (earnings per share)” are all sloping upwards from left to right. Other criteria under “Legend” on the right can also be enabled.
For a deeper understanding of the meaning of the summary screen above, let’s switch to the CoreSSG tool by opening the URL below (this is the same URL as above, only ‘ssgplus’ is changed to ‘coressg’):
https://ssg.betterinvesting.org/trial/coressg.aspx?studyid=14852657&sk=48125
You could change which stock symbol you are looking at by clicking on “Quick Navigation”, but in the trial version only a few different symbols will be available. Let’s discuss a little about how to find good stocks to analyze in the next section.
Finding Good Stocks
The full product does have a ‘heat map’ of studies other BetterInvesting users have done, which is a good method for finding stocks to look at. There are more brute force methods such as using scripts to open the website in a browser to quickly navigate many symbols, see at a glance whether they are interesting, and look at hundreds of symbols in one sitting to try to find “hidden gems”. This method won’t be discussed here, and is of nominal advantage over using the heat map (as companies that aren’t generating a lot of news buzz won’t see a lot of market volume either).
Using The CoreSSG Tool
The screen you brought up (here’s the link again) should look as shown in the screenshot below
https://ssg.betterinvesting.org/trial/coressg.aspx?studyid=14852657&sk=48125 :
Because CoreSSG is like a “tutorial mode” - it provides “Back” and “Next buttons to go through all the steps for evaluating a stock (just under the “Analyze Growth” button shown below:
You can study the notes given in the “Education” field which are very helpful:


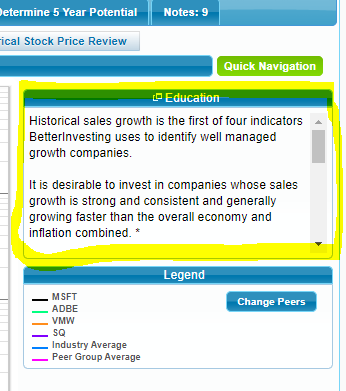
Here are screenshots for each step of CoreSSG. Again, the Education field provides good background for what is shown in each screenshot. There will be some additional discussion provided below.
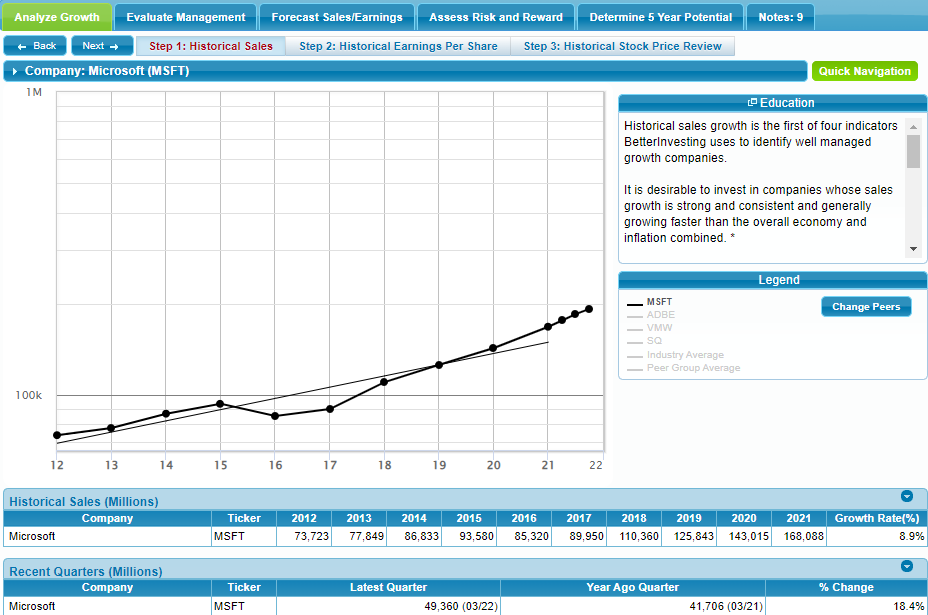
Figure 1: Historical Sales
Figure 2: Historical Earnings Per Share


Figure 3: Historical Stock Price Review

Figure 4: % Pre-Tax Profit on Sales
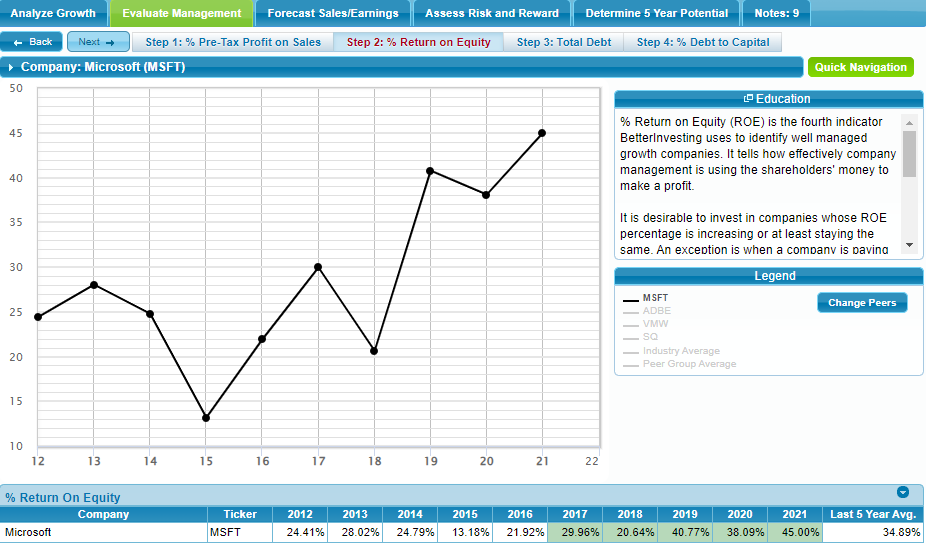
Figure 5: % Return on Equity

Figure 6: Total Debt

Figure 7: % Debt to Capital
Figure 8: Forecast Sales
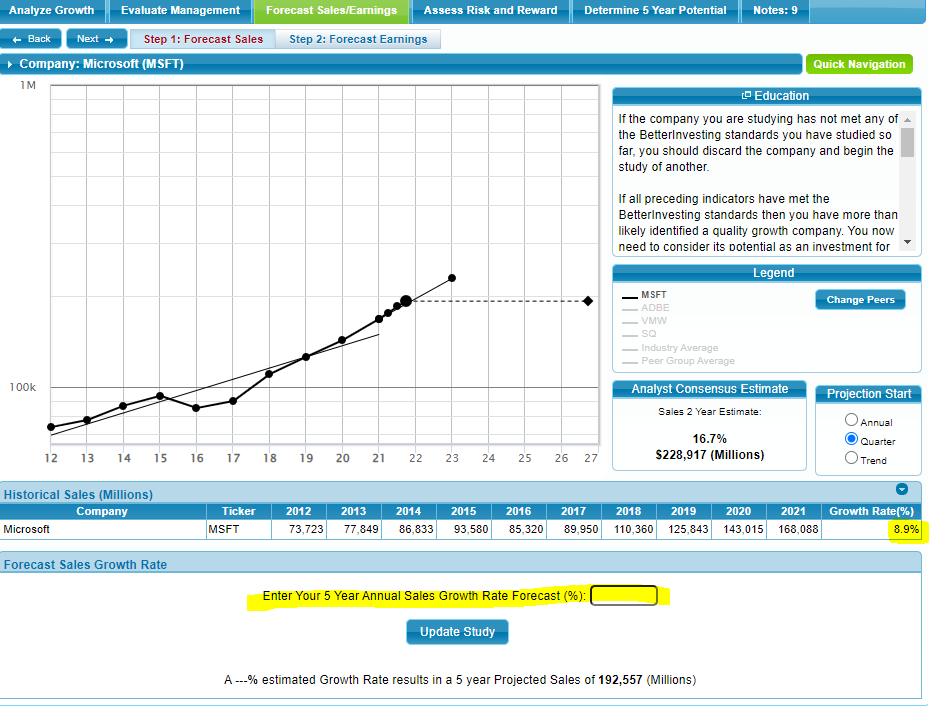
Figure 8: Forecast Sales is the first screen in CoreSSG which requires filling in the “Enter Your 5 Year Annual Sales Growth Rate Forecast (%)” field. Try using the same value as shown under “Growth Rate(%)” in the lower left corner of the screen, or adjust your estimate according to the current economic situation (i.e. is the economy booming, or going into a recession, etc.). There are other details provided in the “Education” field too.
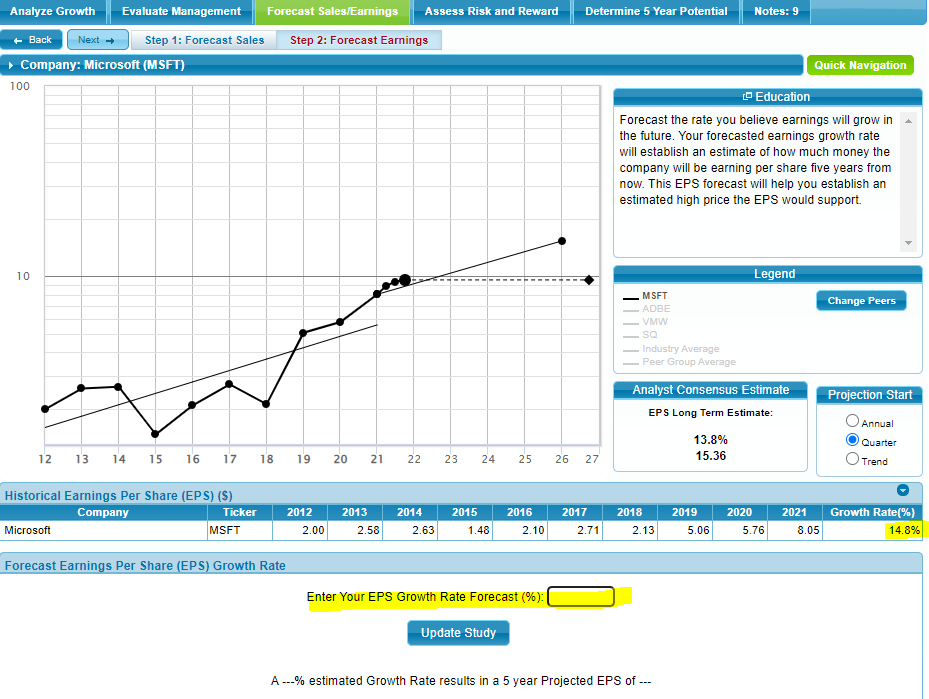
Figure 9: Forecast Earnings
Similarly, Figure 9: Forecast Earnings asks that you fill in the EPS Growth Rate Forecast (%) field.
By filling in these forecasts of Sales and Earnings, high and low estimates of PE and EPS give a basis for the high and low price estimates which will establish when to buy and when to sell, based on these forecasts. We’ll see this in later steps below.

Figure 10: Forecast High Price
The forecast high price is calculated from your average high PE forecast multiplied by your high EPS forecast. In Figure 10: Forecast High Price, values of 30 and 15 were entered for MSFT, which will be different for whatever symbol is being evaluated. After entering these values, be sure to click “Update Study”.
Discussion
Forecasting the future PE, in practice, simply means putting in a reasonable number based on the 2 average P/E values shown in the lower left of the screen (just above the “Update Study” button). Find the EPS forecast of “Figure 9: Forecast Earnings”, marked as “Analyst Consensus Estimate: EPS Long Term Estimate” shown in the figure as 13.8%.
It is worth noting: the more “glamorous” a stock is, the more “enthusiastic” (or perhaps “insane”) the market tends to be. The market will pay less attention to company fundamentals and more on hype. So as a result, the PE forecast will be higher than a more glamorous stock. I.e. the price will be higher, regardless of earnings, for such a stock.
You will probably start to notice that, when comparing stocks and all other things being equal (for example earnings), the price will be inflated or deflated relative to the “glamor” of a stock. For a less popular stock with excellent fundamentals, the PE will tend to be lower than if it is a well-known brand name with the same fundamentals or worse. You will start to see a range of low PE which marks a good support price (where investors will buy the stock, causing it to go up in price, when it had previously been falling), and that range of low PE will be specific to that symbol, according to how glamorous that stock is. NOTE: It begs the question, do some companies inflate their brand-name even when they have poor fundamentals, in order to inflate stock price? By using these tools, we can avoid such companies by getting a clear picture of their fundamentals (both current and historical).
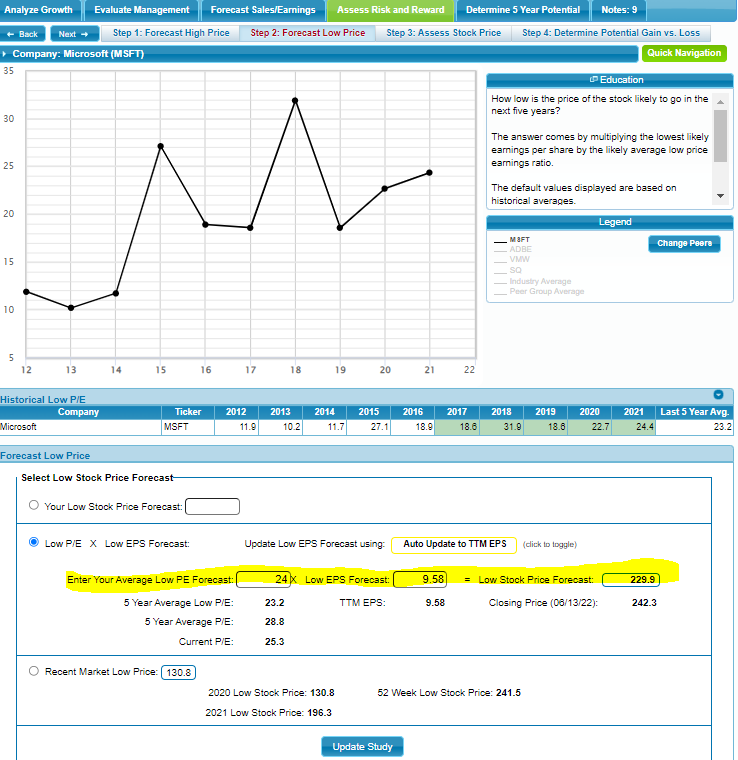
Figure 11: Forecast Low Price
For Figure 11: Forecast Low Price, follow a similar process as you did for Figure 10: Forecast High Price.

Figure 12: Assess Stock Price
Figure 12: Asses Stock Price provides a range of prices that indicate where to place a buy order, and where to place a sell order, using your previous estimates. It will show “Invalid” if there are any issues with the estimates you provided.
Figure 13: Determine Potential Gain vs. Loss
In Figure 13: Determine Potential Gain vs Loss, the “Upside Downside Ratio” gives the probably of gain versus loss - and is recommended that at least 3 times the probability of gain makes an investment desirable.
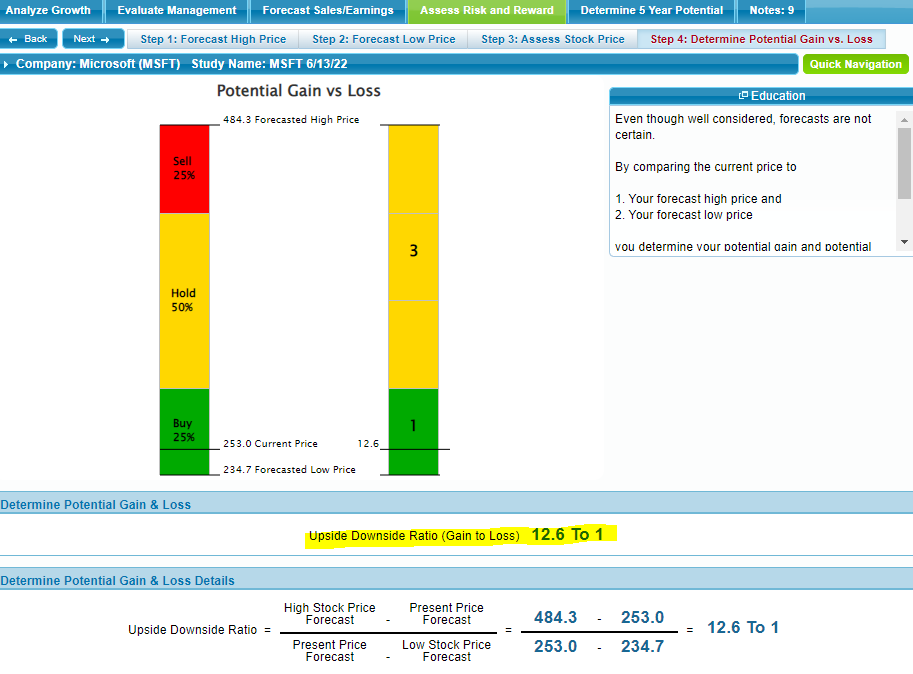

Figure 14: Determine 5 Year Potential
This figure shows the annual rate of return assuming you are able to trade at the forecast high and low P/E.
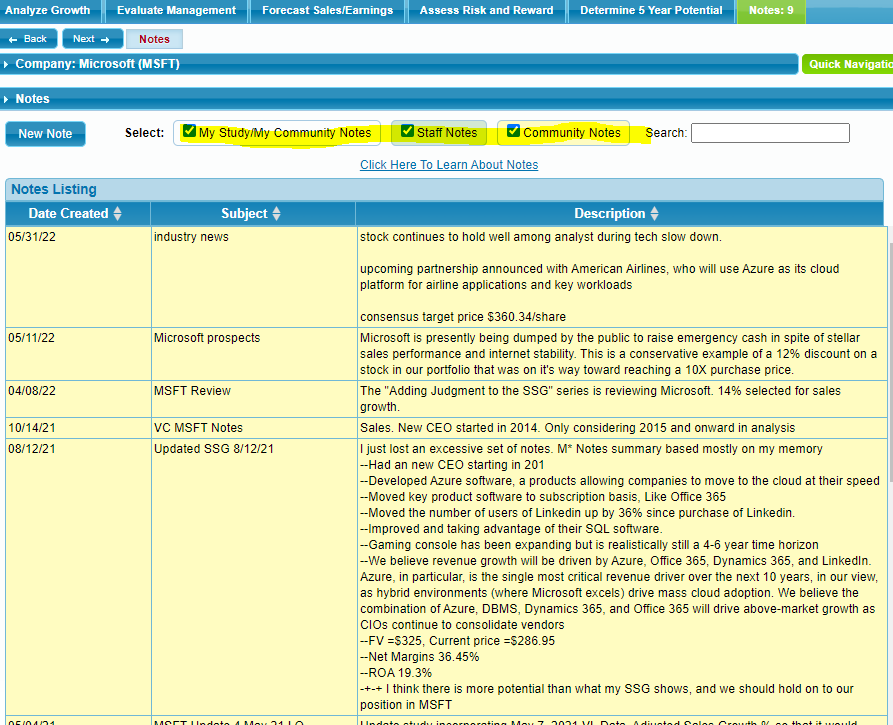
Figure 15: Notes
Staff, community and your own notes can be accessed here.

Summary
By using the CoreSSG or SSGPlus tools, you can remove the guesswork of how healthy a company is, and calculate buy and sell prices for trading that company. Compared to technical trading, this is a very slow strategy that depends on yearly cycles, rather than short-term news events, to drive when to get in and out of a position.
No comments:
Post a Comment